DrawBot - My Coolest Project So Far
Fast Read:
- I decided to improve how logistics diagrams were drawn (without being told)
- I automated the whole process, making it faster and more accurate.
- I learned how to use different libraries in python and work with lots of data
- The program can now do the job faster and more accurately, saving ~$23,000 a year and 400 hours
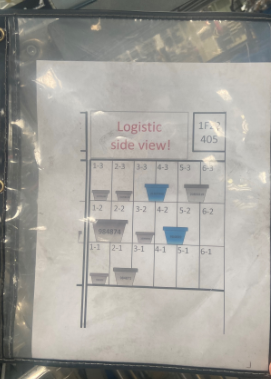
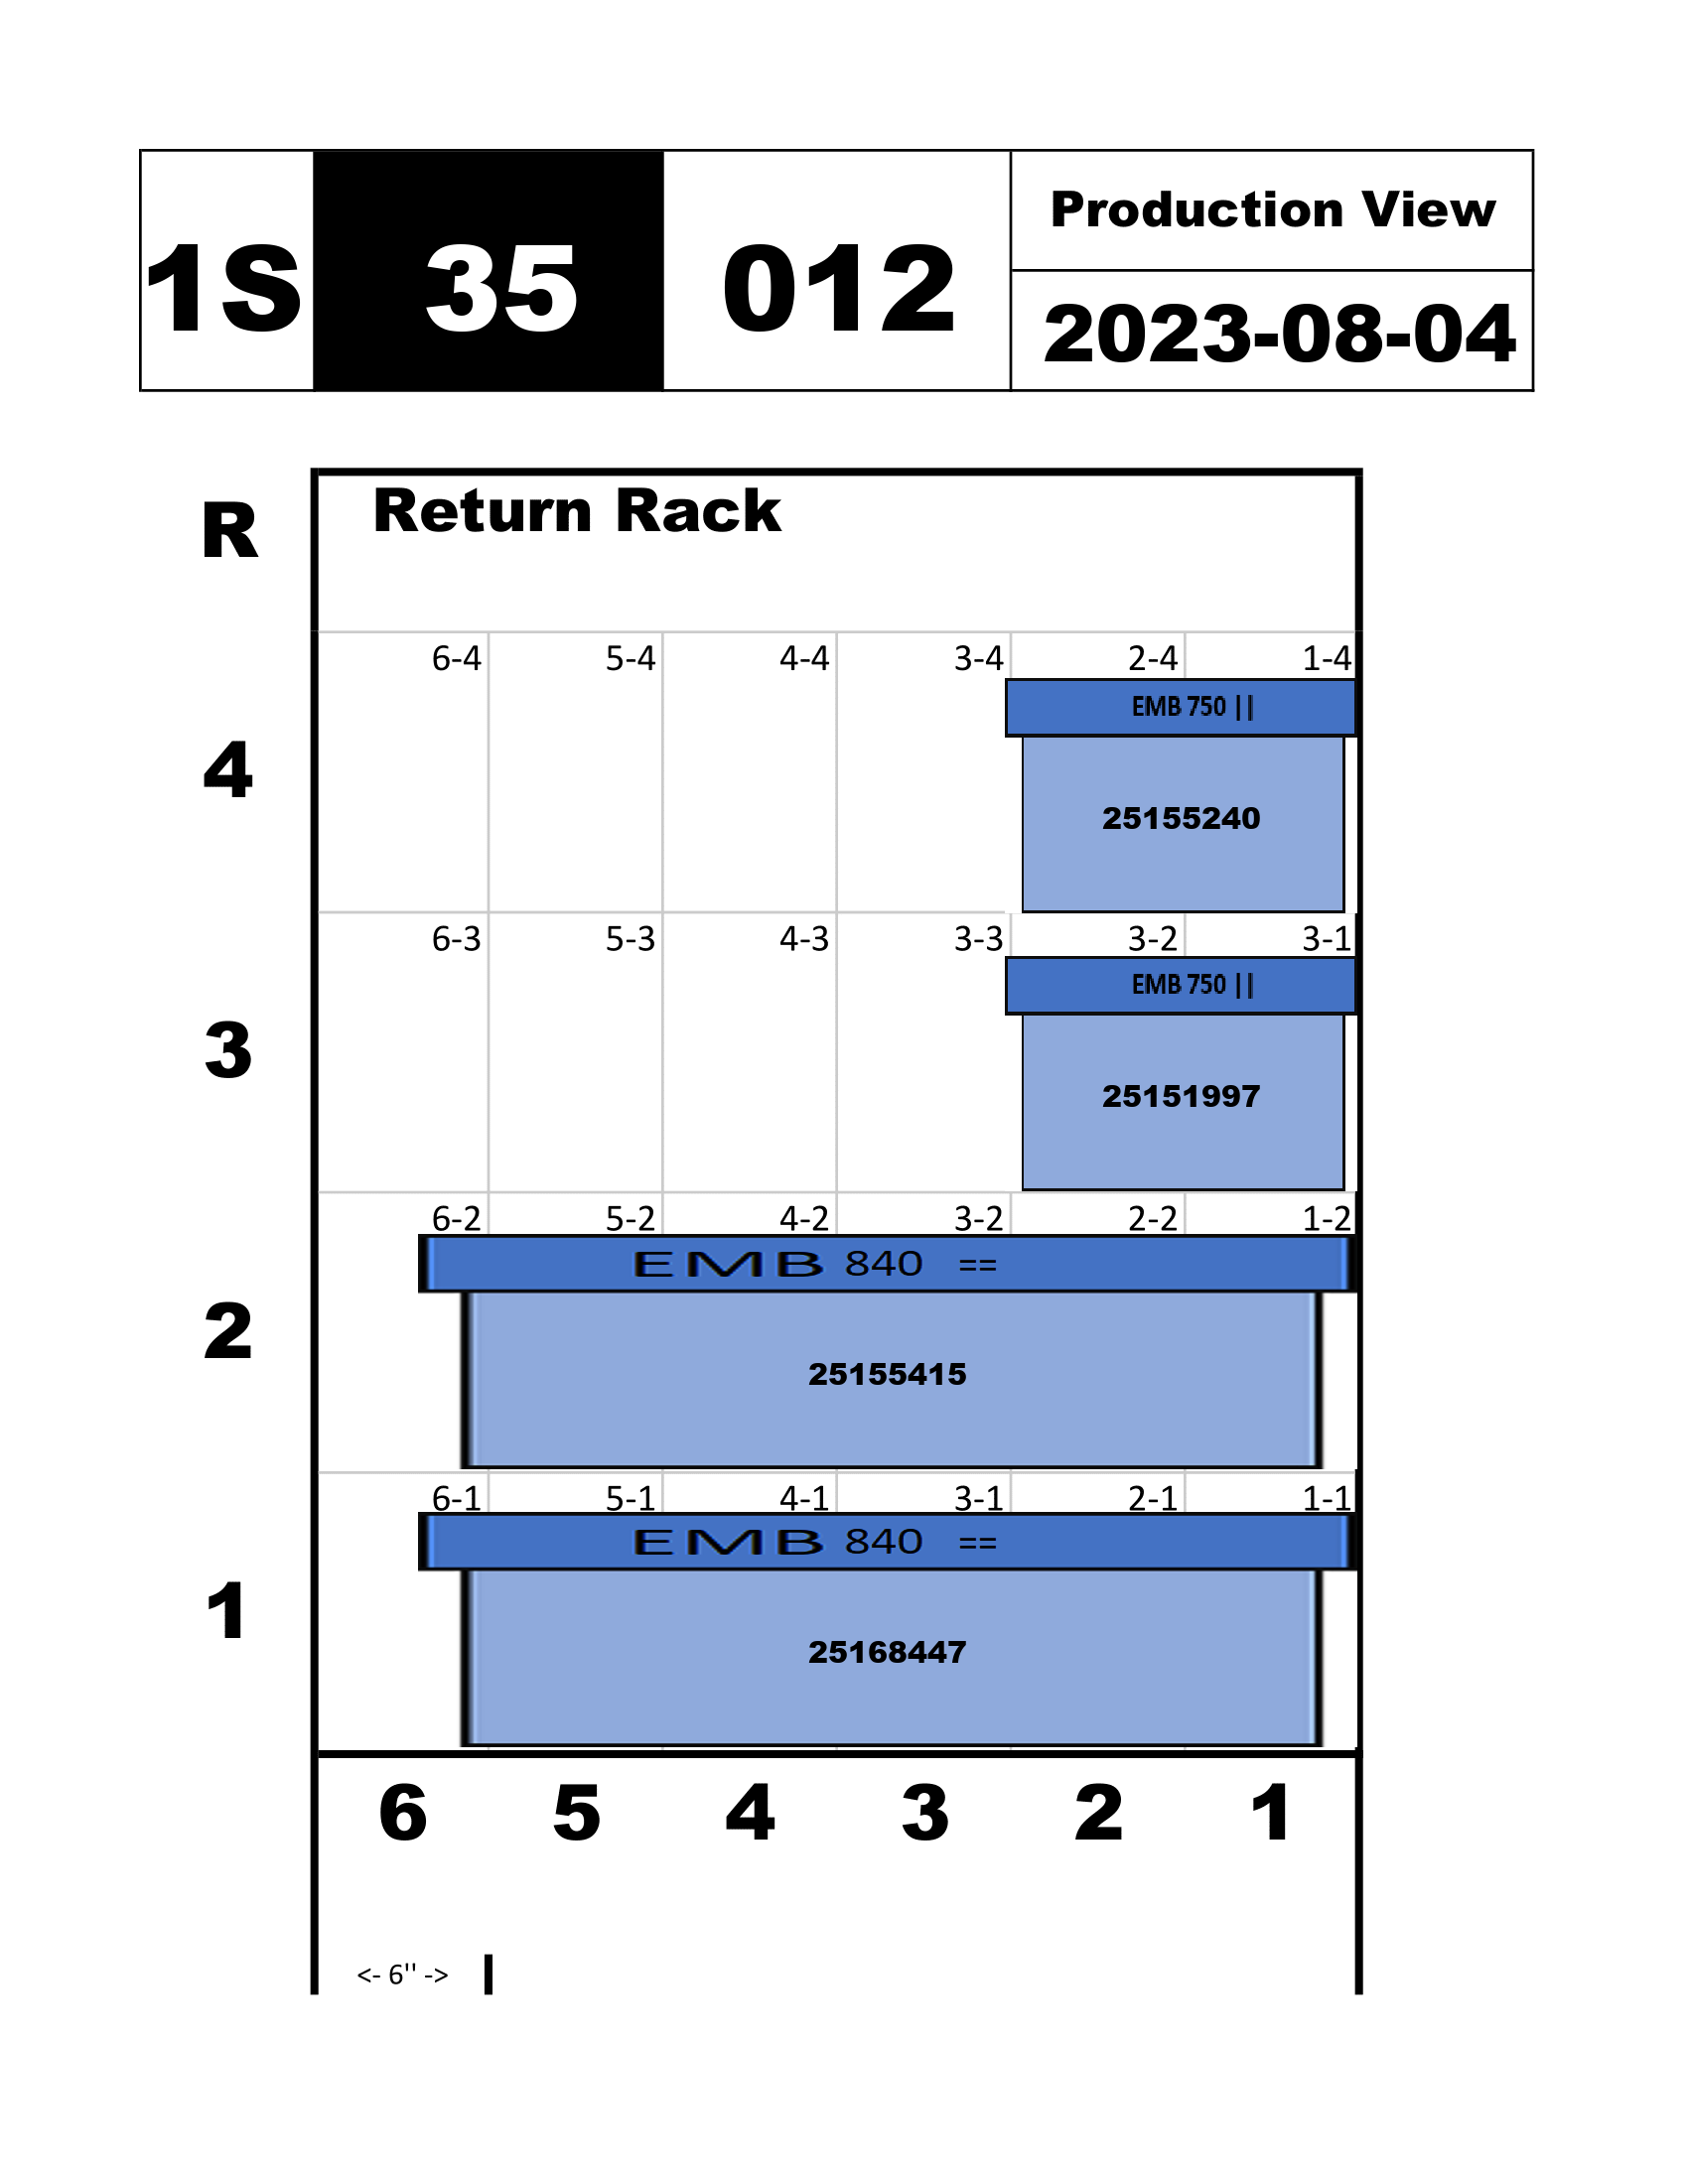
During the summer of 2023, I was an industrial engineering intern at Mack Trucks, where I worked in the logistics department. At Lehigh Valley Operations (LVO) all parts came in standard boxes called emballages or totes. These were loaded onto racks like those shown below. When the first box was empty, it was moved out of the way and the next box rolled forward.
The racks had a “flag” with the location ID and two diagrams, the logistic view and production view of the cart. Not all carts had these flags, it was going to be a new plant standard. That meant that, as a conservative estimate, at least 500 racks would need these diagrams. So, over 1000 drawings.
Rack Flag
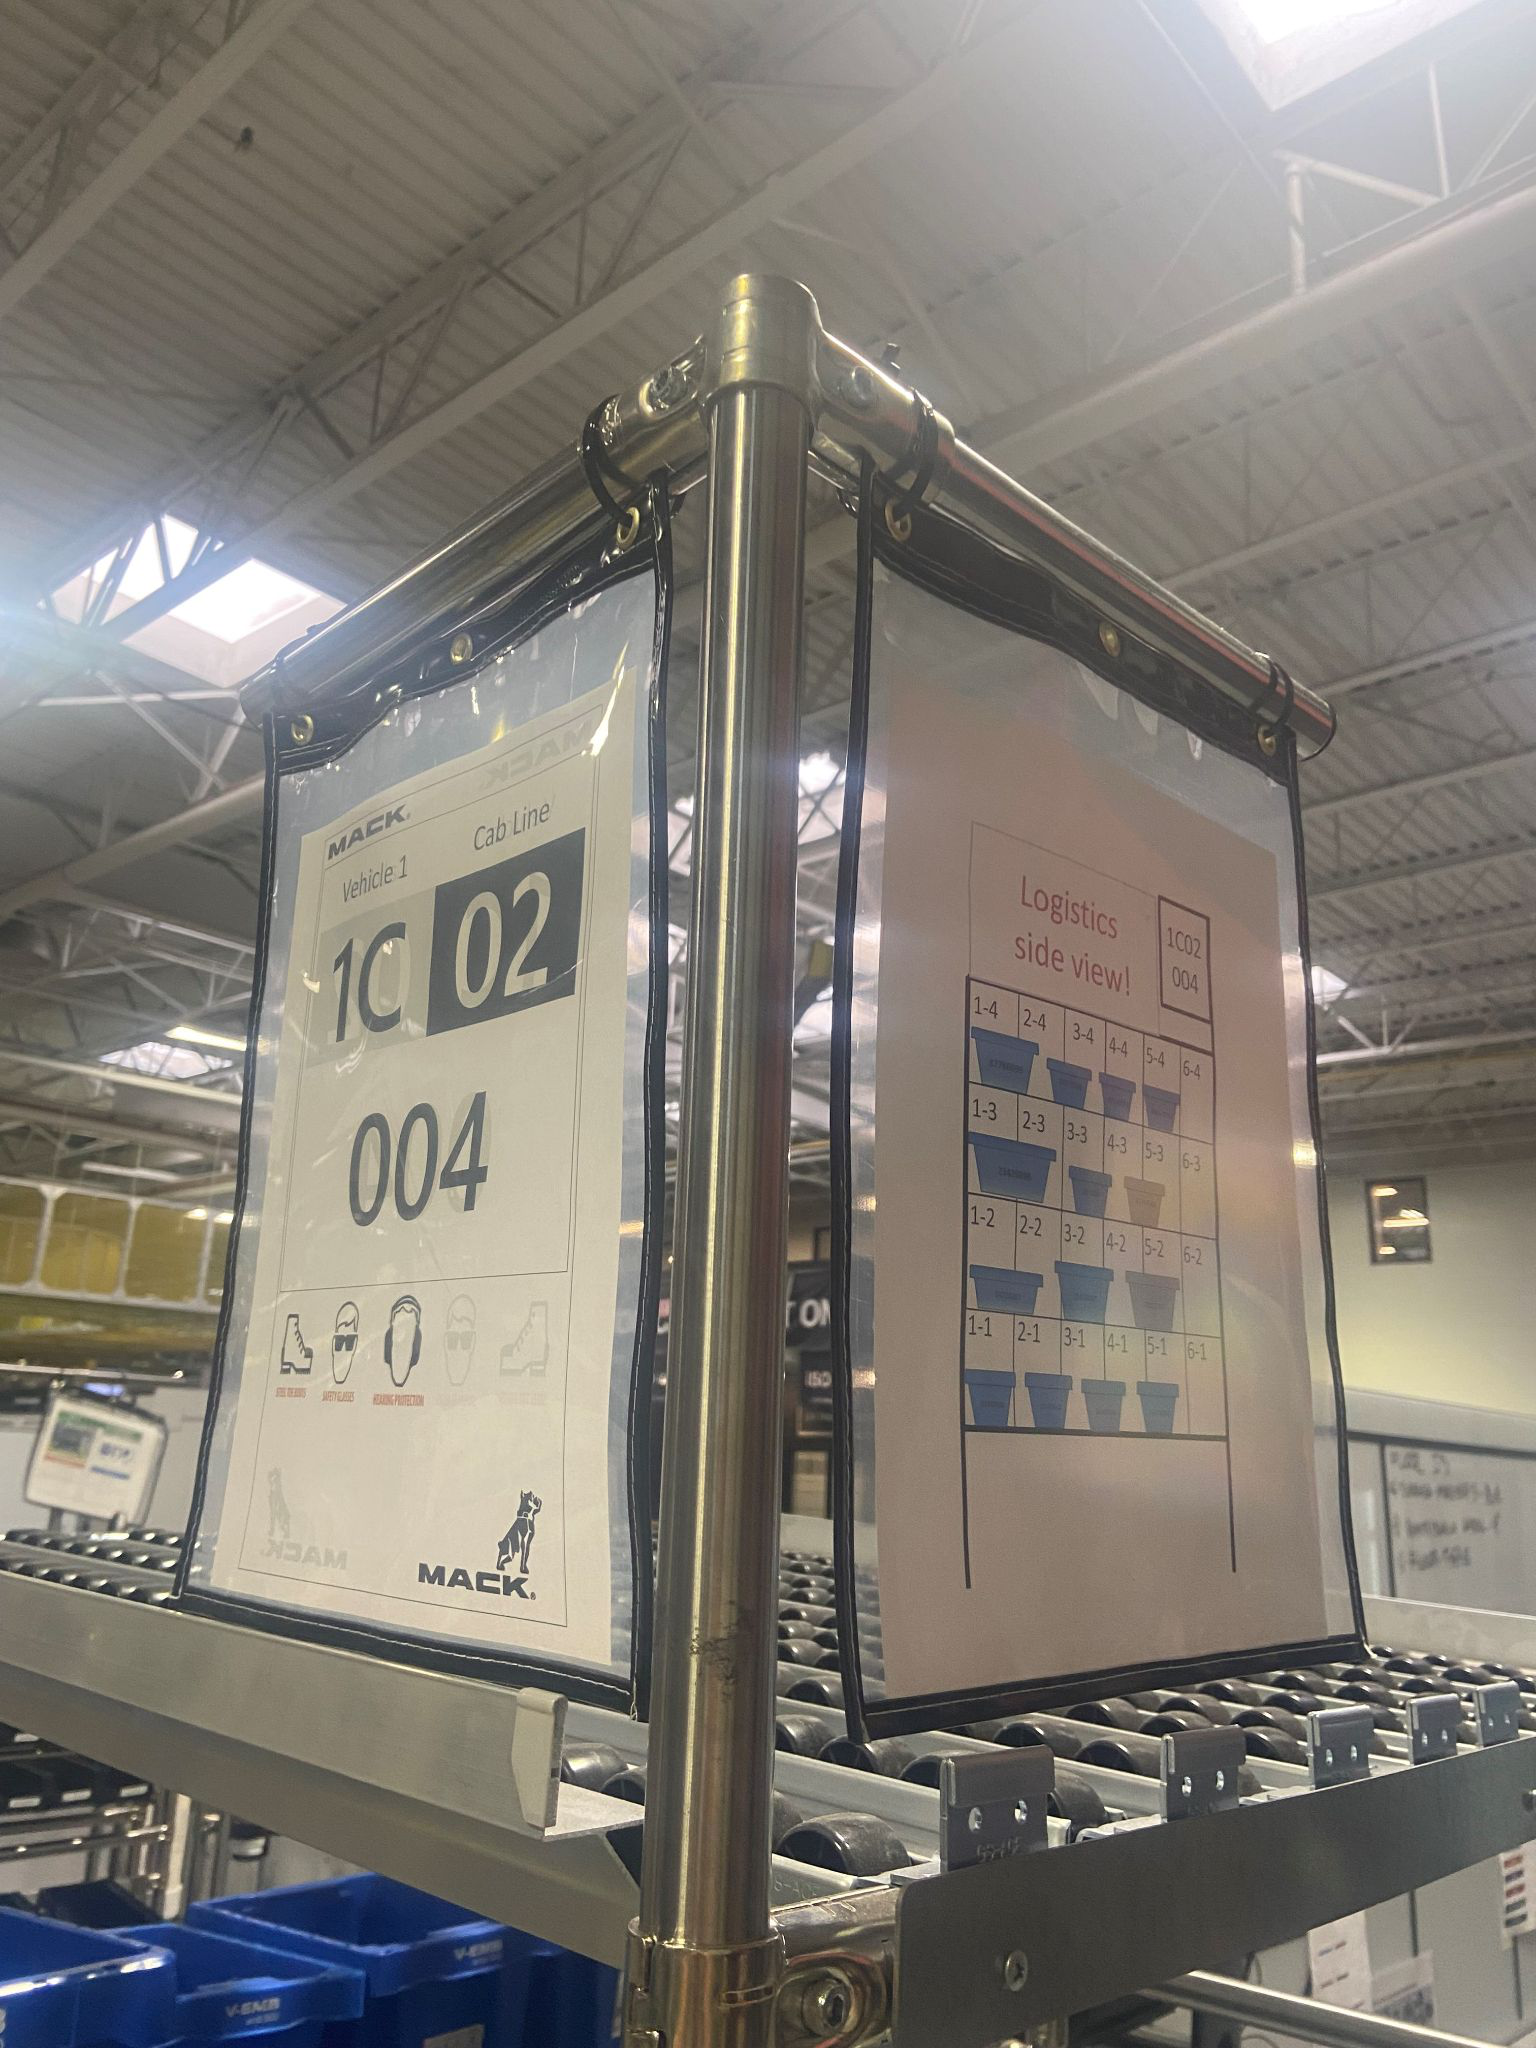 Flags on a rack
Full Rack, Production Side

The Challenge
Making these drawings… was not fun. Each tote was copied, pasted, and dragged into position by engineers who had better things to do. Part numbers were manually typed. Create text box, resize text box, type part number, etc. This was slow, inaccurate, and worst of all had to be done all over again for the production view, which is a mirror image.
Rack Diagram
An Opportunity
During summer shutdown, all the departments go on vacation except logistics. On a very tight schedule, the logistics team makes the moves they’ve been planning for months. It was my last two weeks and all my supervisors and coworkers were very busy with work that an intern couldn’t really help with. In short, I was totally unsupervised. I guess I could’ve kicked back, drank the coffee, and relaxed for two weeks.
… or I could try to pull this off.
Programming and Programming and Programming
I won’t go line by line with my code, but it really stretched my skills as a programmer of 3 months. I used PIL, the python imaging library, to paste the totes onto the diagram with pixel perfect precision. I got used to working with Pandas, which is a library to work with large databases.
Halfway through the project I realized that I could have my program read directly from the plant database. Until then my program took the manual clicking and dragging out of the work. Connecting to the database meant that at the click of a button, the bot could pull the information it needed and draw all the diagrams. Not all the diagrams for the rack, or for the aisle, but for the whole plant.
Some code I wrote
def main():

plant_df = clean_input_data()
print(print_settings_df)
print()
input("If these settings are correct, hit any key. Otherwise, change them in the READ File - Settings Sheet")
draw_plant(plant_df)
print("DBOT - Draw Logi and Prod Views - Program Complete")
input()     # program stays open until a key is pressed
for index, tote in row_df.iterrows():
part_num = round(tote["Part Number"])
type_of_tote = tote['Emballage Type']
try:
type_of_tote = round(type_of_tote)
except TypeError:
type_of_tote = type_of_tote
print(f"Drawing {tote['Orientation']}
{type_of_tote} at
{tote['Location']}
{tote['Column']}
{tote['Row']},
PN: {part_num}")
tote_space_taken = find_space_taken(tote)
tote_im = get_tote_im(tote)
tote_width, tote_height = tote_im.size
vert_offset = get_vert_offset(tote,tote_height)The only limitation was how fast the computer could chew up the data
IF good, showteam()
Here’s an example drawing using my program versus a previous file. This is formatted for a standard 8.5x11 sheet of paper and saved them as pdfs and pngs..
Status Quo
Updated Version
IF team_likes_it == TRUE; return results.df
My last Friday meeting, I showed the team. It was really fun to surprise the team with something that “they had been asking for, for years!” To say that they were impressed is an understatement. One of the full time engineers who had been working there for five years had apparently asked for something like this before and the IT department said that “it would never happen.” I made it happen in a week!
This program could draw over 1000 diagrams in the time it took one full time engineer to make a single diagram. Working with my supervisors, we decided that for 400 drawings, an hour a drawing, $57 an hour, this project would save $22,800 a year. Presumably it would have an additional savings for the first big print to get all racks up to standard.
This has other benefits too. Production views weren’t being drawn because they took too much time, but they are super useful. I knew as well as anyone that the logistic department terminology was different than material handling, and different than the manufacturing department, you get the idea. The best part of this project was effectively giving other people the information they needed to improve ergonomics for their station.